October Weather in Gandia, Spain - 2026
Gandia is the second-largest city in the Valencia region situated on the Costa del Azhar. It is primarily known for its beaches but the surrounding countryside, mountain ranges, vineyards and orange groves are also worth a visit. Gandia has a train line directly to Valencia which is great for visits to the city. A popular destination due to its weather, beaches and historical sites, the visitors will be awed by the spectacular festive scene of the city too. The Festival of Fallas is a massive fiesta of outstanding fireworks and unlimited fun and the celebrations leading up to it are worth the stay in the city.
Gandia is also the birthplace of Fideuà which is a popular seafood dish. You can actually enjoy the authentic taste of Spanish cuisine in many restaurants around Gandia.
Generally, October in Gandia will be really nice, with an average temperature of around 77°F / 25°C. But due to the very dry air, it can feel somewhat uncomfortable for some people. You can expect around 10 rainy days, with on average 2.2 inches / 57 mm of rain during the month of October.

Contents
- 1 October weather in Gandia Spain
- 2 October weather in Gandia Spain in more detail
- 3 What to do in Gandia Spain in October
- 4 Is it humid in Gandia Spain in October?
- 5 Is October a good time to go to Gandia Spain?
- 6 Does it rain all day in Gandia Spain in October?
- 7 Is October the rainiest month in Gandia Spain?
- 8 Is October the most sunniest month in Gandia Spain?
- 9 More information about Gandia Spain
- 10 Weather in Gandia Spain in other months
- 11 What to do in Gandia Spain for each month
October weather in Gandia Spain
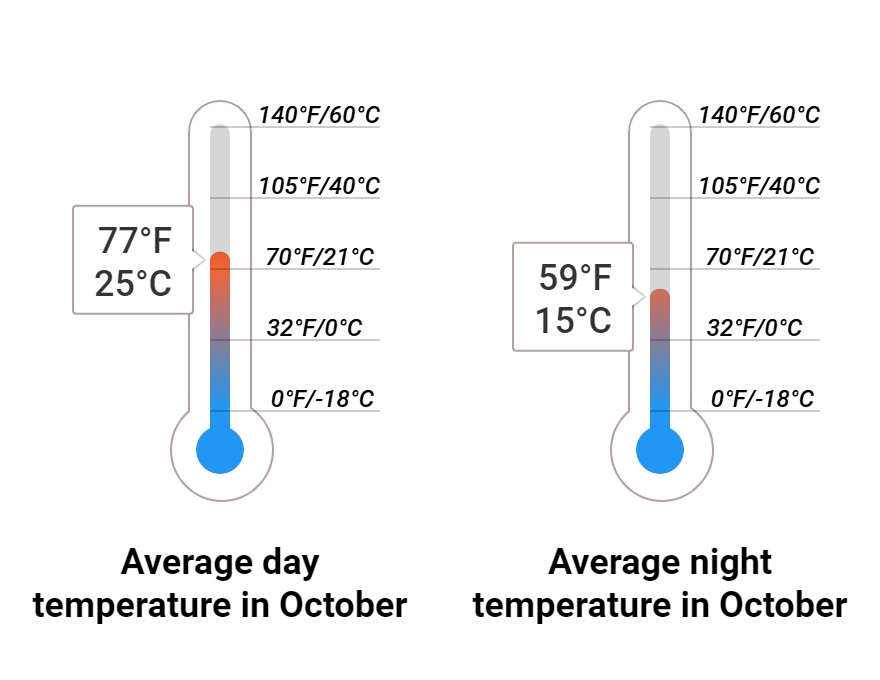
To get a good overview of the type of weather you can expect in October in Gandia, we will look at the day and night temperature, minimum and maximum water temperature, and if October is comfortable or humidGenerally, October in Gandia will be really nice. Historical data shows that you can expect an average temperature of around 77°F / 25°C. But due to the very dry air, it can feel somewhat uncomfortable for some people. During the night, it will cool down to around 59°F / 15°C.
Gandia has rainy days in October. You can expect around 10 rainy days, with on average 2.2 inches / 57 mm of rain during the whole month.
October weather in Gandia Spain in more detail
To get a better feeling for the type of weather, you can expect in October in Gandia, we will look at the temperature, rain, wind, humidity, water temperature, and sun and clouds- What will the temperature be in Gandia in October
Generally, you can expect in October an average temperature of 77°F / 25°C during the day and an average of 59°F / 15°C during the night. In October, during the warmest part of the afternoon, the temperature can often get as high as 89°F / 32°C, and at the end of the night, it can get as low as 46°F / 8°C.
When looking at the whole year, January is the coldest month, with an average temperature of around 60°F / 16°C. July and August are the hottest months, with an average temperature of around 93°F / 34°C. When comparing October with the temperature in the month before and after, this is slightly lower than September, which sees an average maximum temperature of around 84°F / 29°C. And more than November, which sees an average maximum temperature of around 66°F / 19°C.
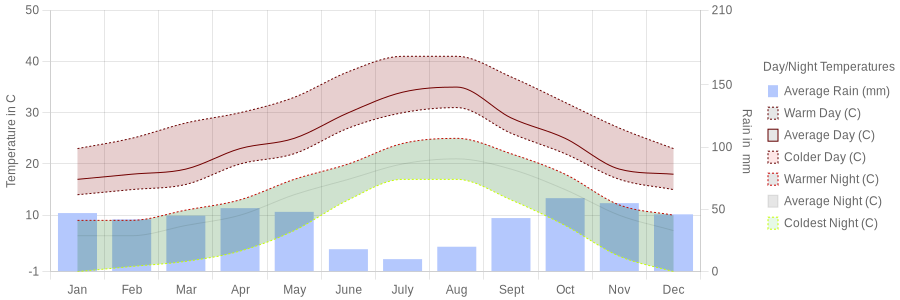
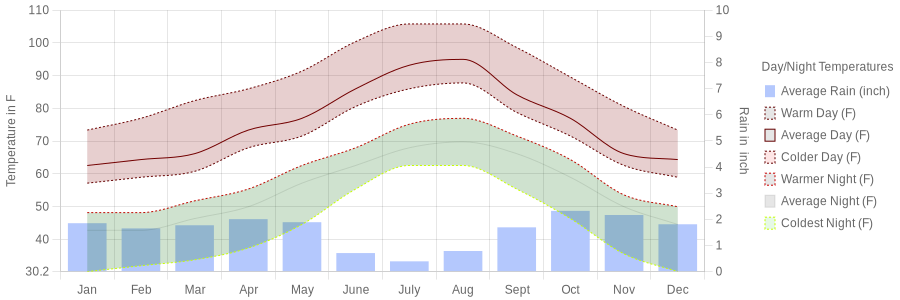
But average temperatures only tell half of the story. It is also good to check the maximum and minimum temperatures. When looking at the whole year, July and August are the hottest months, with a temperature of around 105°F / 41°C. January and December are the coldest months, with a temperature of around 73°F / 23°C. When comparing October with the temperature in the month before and after, this is slightly lower than September, which sees an average maximum temperature of around 98°F / 37°C. And slightly more than November, which sees an average maximum temperature of around 80°F / 27°C.
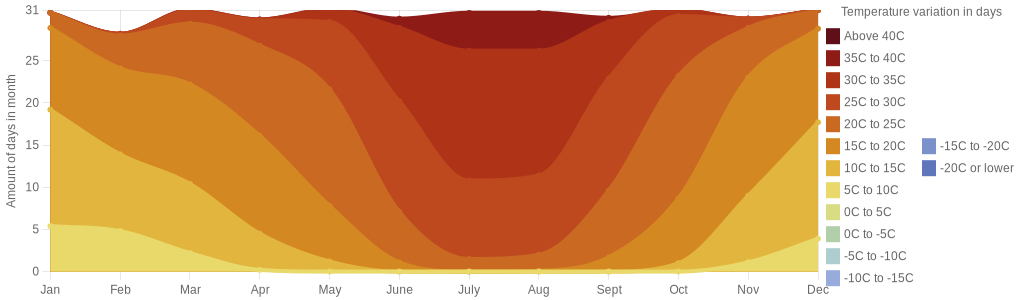
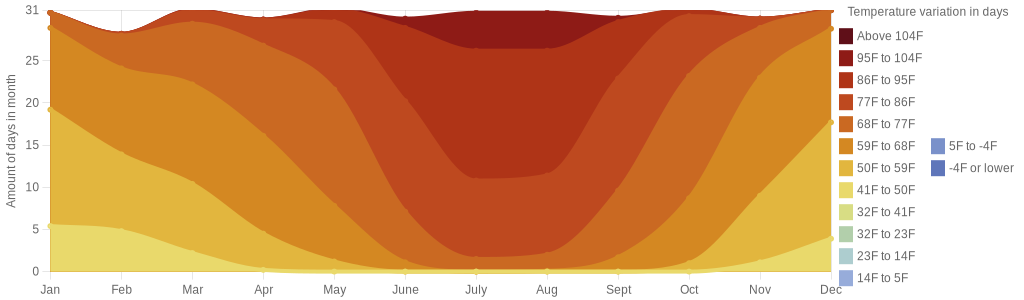
In the following graph, you can see how many cold and hot days you can expect in Gandia each month:
- Can you expect rain in October in Gandia?
Generally, you can expect about 10 rain days in October, with on average 2.2 inches / 57 mm of rain.
When looking at the whole year, July is the dryest month, with an average rainfall of around 0.3 inches / 8 mmmm. October is the wettest month, with an average rainfall of around 2.2 inches / 57 mmmm. When comparing October with the month before and after, this is a lot more than September, which sees around 1.6 inches / 41 mm of rain. And slightly more than November, which sees around 2 inches / 52 mm of rain
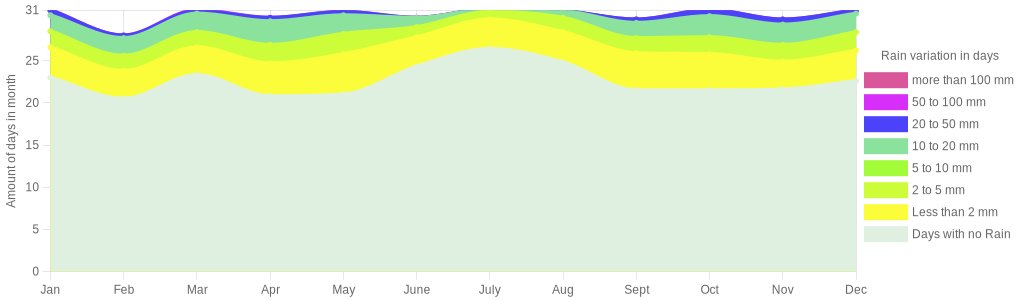
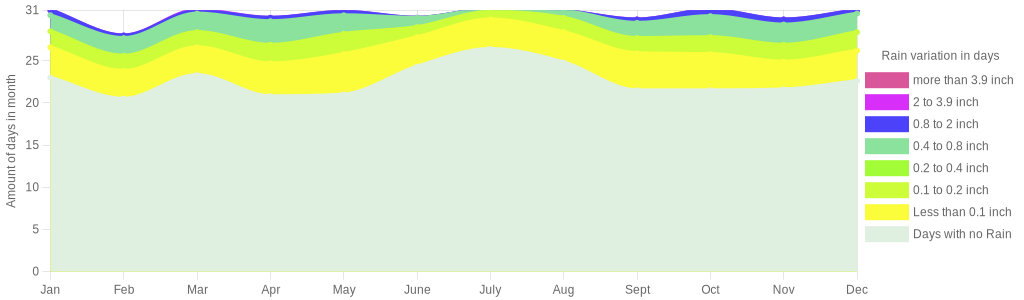
If we look at the number of days with rain, July is the month with the least amount of rain days with an average of between 4 and 5 days. May is the month with the most rain days with around 10 days. When comparing October with the month before and after, this is almost equal to September, which sees an average of between 8 and 9 days of rain. And almost equal to November, which sees an average of between 8 and 9 days of rain
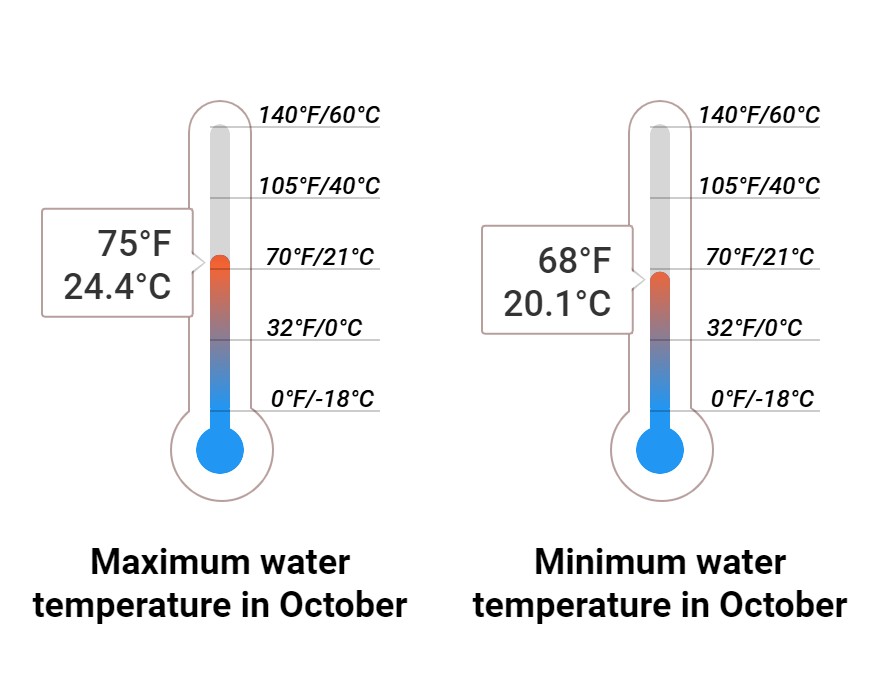
- What will the water temperature be in Gandia for October
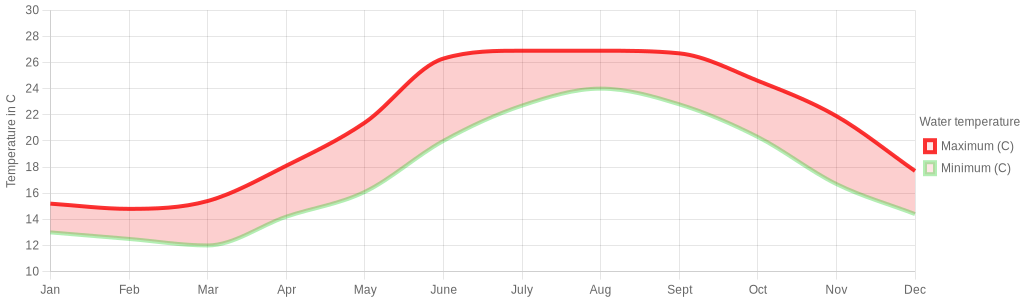
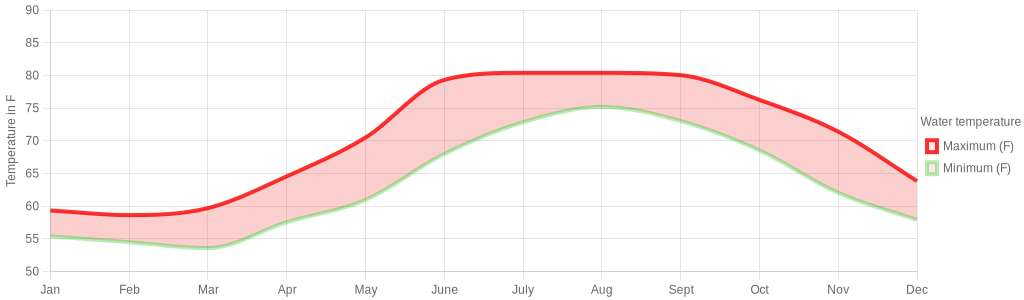
You can expect in October, the water temperature for Gandia to be between 75°F / 24°C and 68°F / 20°C.
To compare the water temperature we will use the maximum water temperature. You can expect this temperature on a more sunny day, close to the shore, when the wind does not mix the relatively warmer and colder water.
August has the highest water temperature, with around 80°F / 27°C. February has the lowest water temperature, with around 59°F / 15°C. When comparing the water temperature from October with the month before and after, October has a water temperature slightly lower than September, with a water temperature of an average of between 78°F / 26°C and 80°F / 27°C. And slightly more than the water temperature from November, that is an average of between 69°F / 21°C and 71°F / 22°C.
- Can you expect in October a lot of sunny days in Gandia
Generally, you can expect around 9 sunny days in October and around 15 partly sunny days. The remaining days will be cloudy.
When looking at the whole year, January is the month with the highest number of sunny days, with an average of between 12 and 13 sunny days. May and September And are the months with the lowest number of sunny days, with an average of between 7 and 8 sunny days. When comparing October with the number of sunny days in the month before and after, it is almost equal to September, with an average of between 7 and 8 sunny days. And slightly less than November, with around 11 sunny days
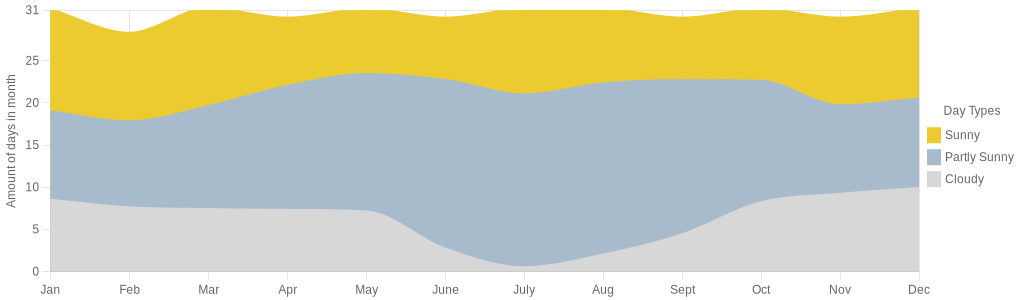
We have looked at the sunny days in Gandia. Let's also look at the cloudy or overcast days. December is the month with the highest number of cloudy days, with an average of between 9 and 10 cloudy days. July is the month with the lowest number of cloudy days, with around 1 cloudy day. When comparing October with the number of cloudy days in the month before and after, it is slightly higher than September, with an average of between 4 and 5 cloudy days. And almost equal to November, with around 9 cloudy days
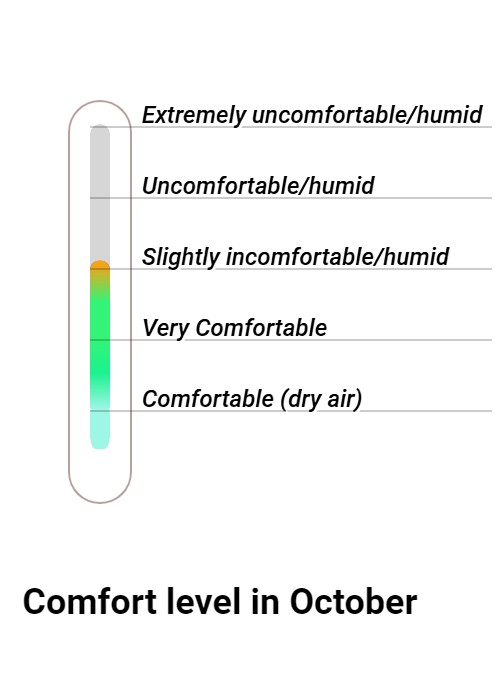
- Will it be comfortable in October in Gandia?
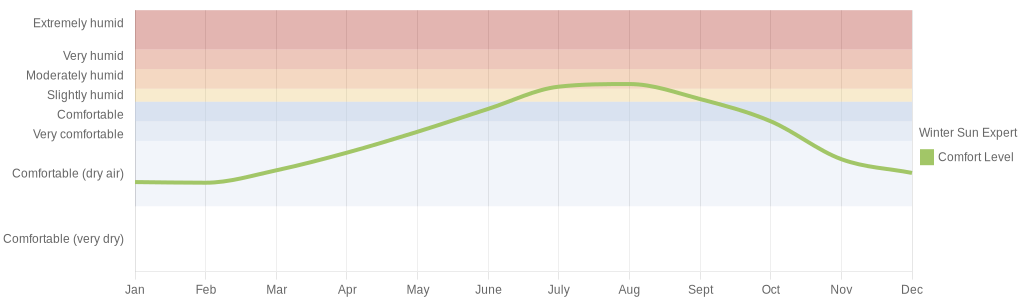
Generally, October in Gandia will have very dry air, and can feel somewhat uncomfortable for some people. But will be fine for most..
We use the humidity and temperature in Gandia to calculate the Wintersun Expert Comfort level for each month. The lower the Wintersun Expert Comfort level, the more comfortable it will be. Only for certain people, extremely dry air can feel slightly uncomfortable.
When looking at the whole year, January has the lowest humidity, with a Wintersun Expert comfort level of "comfortable" (very dry air). July has the highest humidity, with a Wintersun Expert comfort level of "comfortable" (not very humid). When comparing October with the month before and after, this is less than September, which has a Wintersun Comfort level of "very comfortable" (low humidty). And slightly more than November, which has a Wintersun Comfort level of "comfortable" (very dry air)
What to do in Gandia Spain in October
There is a lot to see in Gandia during the wintertime. Some of them include:
- Gandia Playa is a wonderful Spanish beach resort in terms of the beauty and crowd.
- Palau Ducal dels Borja Gandia is a historic landmark. The palace itself is very impressive and excellently preserved.
- Casa de la Marquesa is a well-used council own building that is the venue for monthly art exhibitions and concerts. Has a quiet shady garden with a kiosk cafe for snacks.
- Colegiata de Gandia is a church located in the historical centre of the city. The architecture is interesting and beautiful.
- Museu Faller of Gandia is the museum which gives you a different experience where you will learn the roots of the Valencian people.
Is it humid in Gandia Spain in October?
A lot of people ask interested in the humidity or relative humidity for Gandia Spain in October. But the real question they want to ask is not about humidity but the amount of moisture in the air. Or better, about comfort. Will it be comfortable in October in Gandia, or will high humidity make it uncomfortable.To answer this question, we have to look at the dew point. Relative humidity can change a lot in Gandia during the day and night, as it changes when the amount of moisture changes and, but also when the temperature changes. It is a lot less reliable for comfort. Where the dew point only varies with the amount of moisture in the air.
Looking at the dew point, we can see that for the month of October, you can expect that Gandia will have very dry air, and can feel somewhat uncomfortable for some people. But will be fine for most..
January is the month with the most comfort. It will have very dry air, and can feel somewhat uncomfortable for some people. But will be fine for most.. July is the most uncomfortable month. It will be moderately humid, and can feel slightly uncomfortable for some. In the graph, you can see that there is a significant difference between the most comfortable and most uncomfortable months
Is October a good time to go to Gandia Spain?
Trying to answer the question of whether October is a good time to go to Gandia is not as easy as it first seems. Some people like colder weather, and others prefer a warmer climate. Some are fine with some humidity, and others are not. If your location has air conditioning, the night temperature is less important.
These are some examples. I will try to answer the question with a more generic person in mind. The more detailed information in this article should be enough to check further if this applies to you as well.
If we look at the average temperature for Gandia in October, we can see that it will be fine for most people. In October, you can expect it to be really nice, with an average temperature of around 77°F / 25°C. But due to the very dry air, it can feel somewhat uncomfortable for some people. During the night, it will be around 59°F / 15°C.
The number of overcast days is more than 5, but you can still the sun with around 9 sunny days and 15 partly sunny days.
The last aspect we will look at is rain. You can expect around 10 rainy days, with on average 2.2 inches / 57 mm of rain during October. More then 5 days rain per month makes the chance higher you will see some rain during a shorter stay. But a day with rain does not mean a day you can not enjoy.
We have looked at the average day temperature, the night temperature, humidity, the number of overcast days, and the rain. We think that October a good time to go to Gandia Spain for most visitors.
Does it rain all day in Gandia Spain in October?
In Gandia, it does not rain all day in October. You can expect around 10 rainy days, with on average 2.2 inches / 57 mm of rain during the month.
Another way of looking at the rain is the number of sunny days. For Gandia Spain, there are, on average 9 sunny days and 15 partly sunny days in October. That clearly shows that it is not raining all the time.
Is October the rainiest month in Gandia Spain?
October is not the month with the most rainy days, and it is the month with the most rain.
To answer what the rainiest month is in Gandia, we will both look at the month with the most rain, and the month with the highest number of rainy days.
May is the month with the the highest number of rainiest days. On average, you can expect 10 days with rain. July is the month with the lowest number of rainy days, with aproximately 5 days.
May is the month with the most rain. This is not equal as the one with the most rainy days. On average, you can expect 2.2 inches / 57 mm of rain. July is the month with the least amount of rain. This is not the same month as the one with the lowest number of rainy days. You can expect approximately 0.3 inches / 8 mm of rain.
Is October the most sunniest month in Gandia Spain?
October is not the month with the most sunny days, not the month with the most partly sunny days, and it is not the month with the lowest number of overcast days.
To answer what the sunniest month is in Gandia, we will of course look at the month with the most sunniest days, but also look at the month with the biggest number of days that are sunny or partly sunny.
January is the month with the highest number of sunny days. On average, you can expect 9 sunny days, and 15 partly suny days. May and September are the months with the lowest number of sunny days.
July is the month with the highest number of sunny days and partly sunny days combined. While February is the month with the lowest number of sunny days and partly sunny days combined.
The last thing we will look at is the number of overcast days. July is the month with the lowest number of overcast days. While December is the month with the highest number of overcast days.
More information about Gandia Spain
Weather in Gandia Spain in other months
- Weather in Gandia Spain for January
- Weather in Gandia Spain for February
- Weather in Gandia Spain for March
- Weather in Gandia Spain for April
- Weather in Gandia Spain for May
- Weather in Gandia Spain for June
- Weather in Gandia Spain for July
- Weather in Gandia Spain for August
- Weather in Gandia Spain for September
- Weather in Gandia Spain for November
- Weather in Gandia Spain for December
What to do in Gandia Spain for each month
- What to do in January in Gandia Spain
- What to do in February in Gandia Spain
- What to do in March in Gandia Spain
- What to do in April in Gandia Spain
- What to do in May in Gandia Spain
- What to do in June in Gandia Spain
- What to do in July in Gandia Spain
- What to do in August in Gandia Spain
- What to do in September in Gandia Spain
- What to do in October in Gandia Spain
- What to do in November in Gandia Spain
- What to do in December in Gandia Spain